Why I don't have access to the real data (yet). Each source sits behind a credential, license, or sharing gate I don't currently have access to: NOAA NCEI bulk/API access requires a registered research project and credentialed account; Rochman Lab SLoPP/FLOPP spectra are shared with lab members and credentialed collaborators only; ERA5 high-volume pulls require an institutional Copernicus account (personal accounts are throttled); HydroSHEDS commercial-grade tiles for the Georgia coastal watersheds require a licensed institutional download; Kaggle Microplastic CV / MP-Set imagery is available but unlabeled for source attribution and too small on its own. The pipeline's loaders are written to pick up real CSVs / TIFFs / spectra from
data/raw/ the moment access is granted.
A multi-modal scaffold for microplastic source attribution
— end-to-end on synthetic data.
A multi-modal pipeline that demonstrates how microplastic detection, polymer identification, graph-based source attribution, and a hardened IoT integrity layer could be wired together for environmental compliance teams. All numbers below are produced on synthetic data; the design and software architecture are real, the validation is not.
Built for environmental compliance teams
Identify hot-spots fast
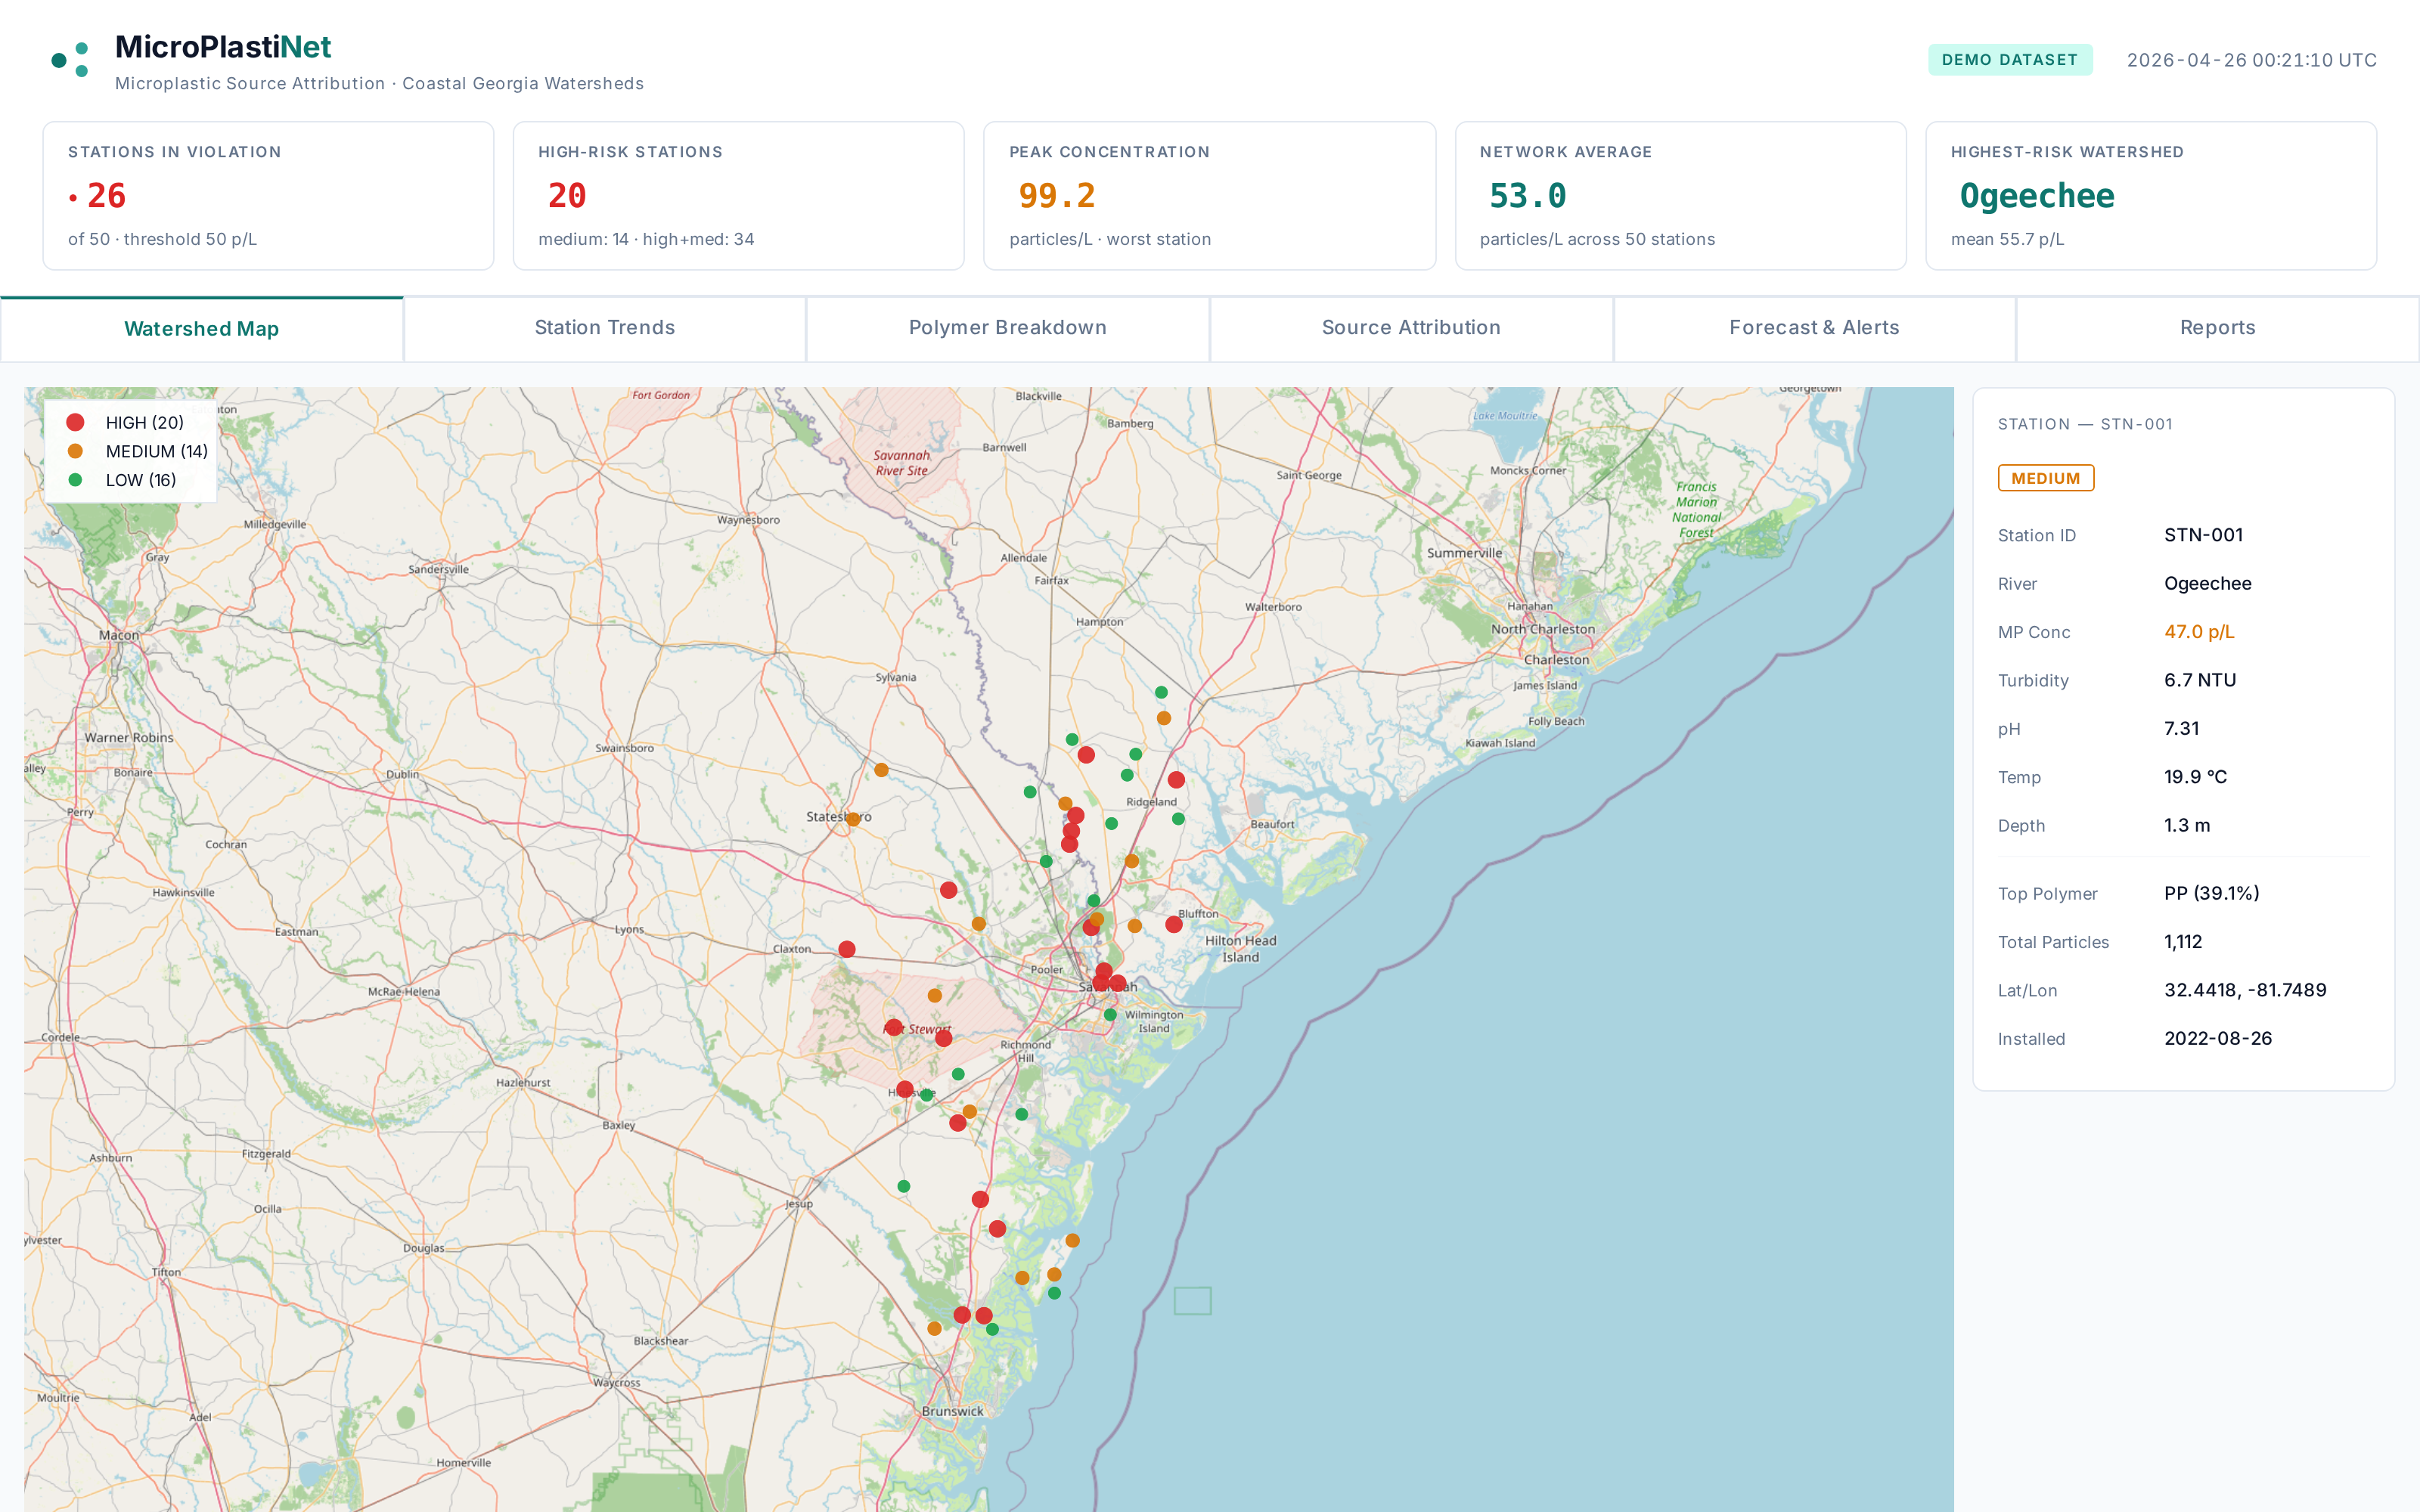
A watershed map ranks every monitoring station by 30-day risk so investigators can prioritize the watersheds and sub-basins that most need a field visit.
Attribute contamination to a probable source
The graph neural network ranks the top five upstream contributors for any flagged station, with confidence intervals and estimated transport distance.
Generate structured compliance reports
One-click PDF + Markdown output wired to CWA § 1251 and EPA 40 CFR Part 131 templates. The report-generation plumbing is real; the underlying evidence is synthetic in this prototype.
Survive adversarial conditions
HMAC-signed payloads, replay protection, and TLS 1.3 transport — because pollution-monitoring IoT is a tampering target the published literature largely ignores.
IoT Edge — sensor fusion + on-device detection
A faithful software twin of an MPN-Edge field unit (ESP32-CAM + SEN0189 turbidity + TDS + AS7265x 6-channel NIR). Sensor noise modeled from real datasheets; on-device first-pass detector emulates a TFLite-Micro logistic gate.
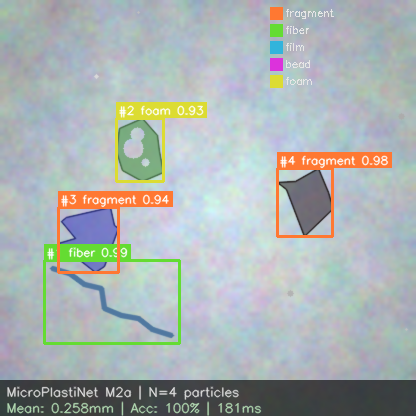
Vision deep learning — particle detection & counting
EfficientNet-B0 + custom TinyYOLO trained on 2,000 synthetic microplastic microscopy images. Drop-in compatible with Kaggle and MP-Set datasets.
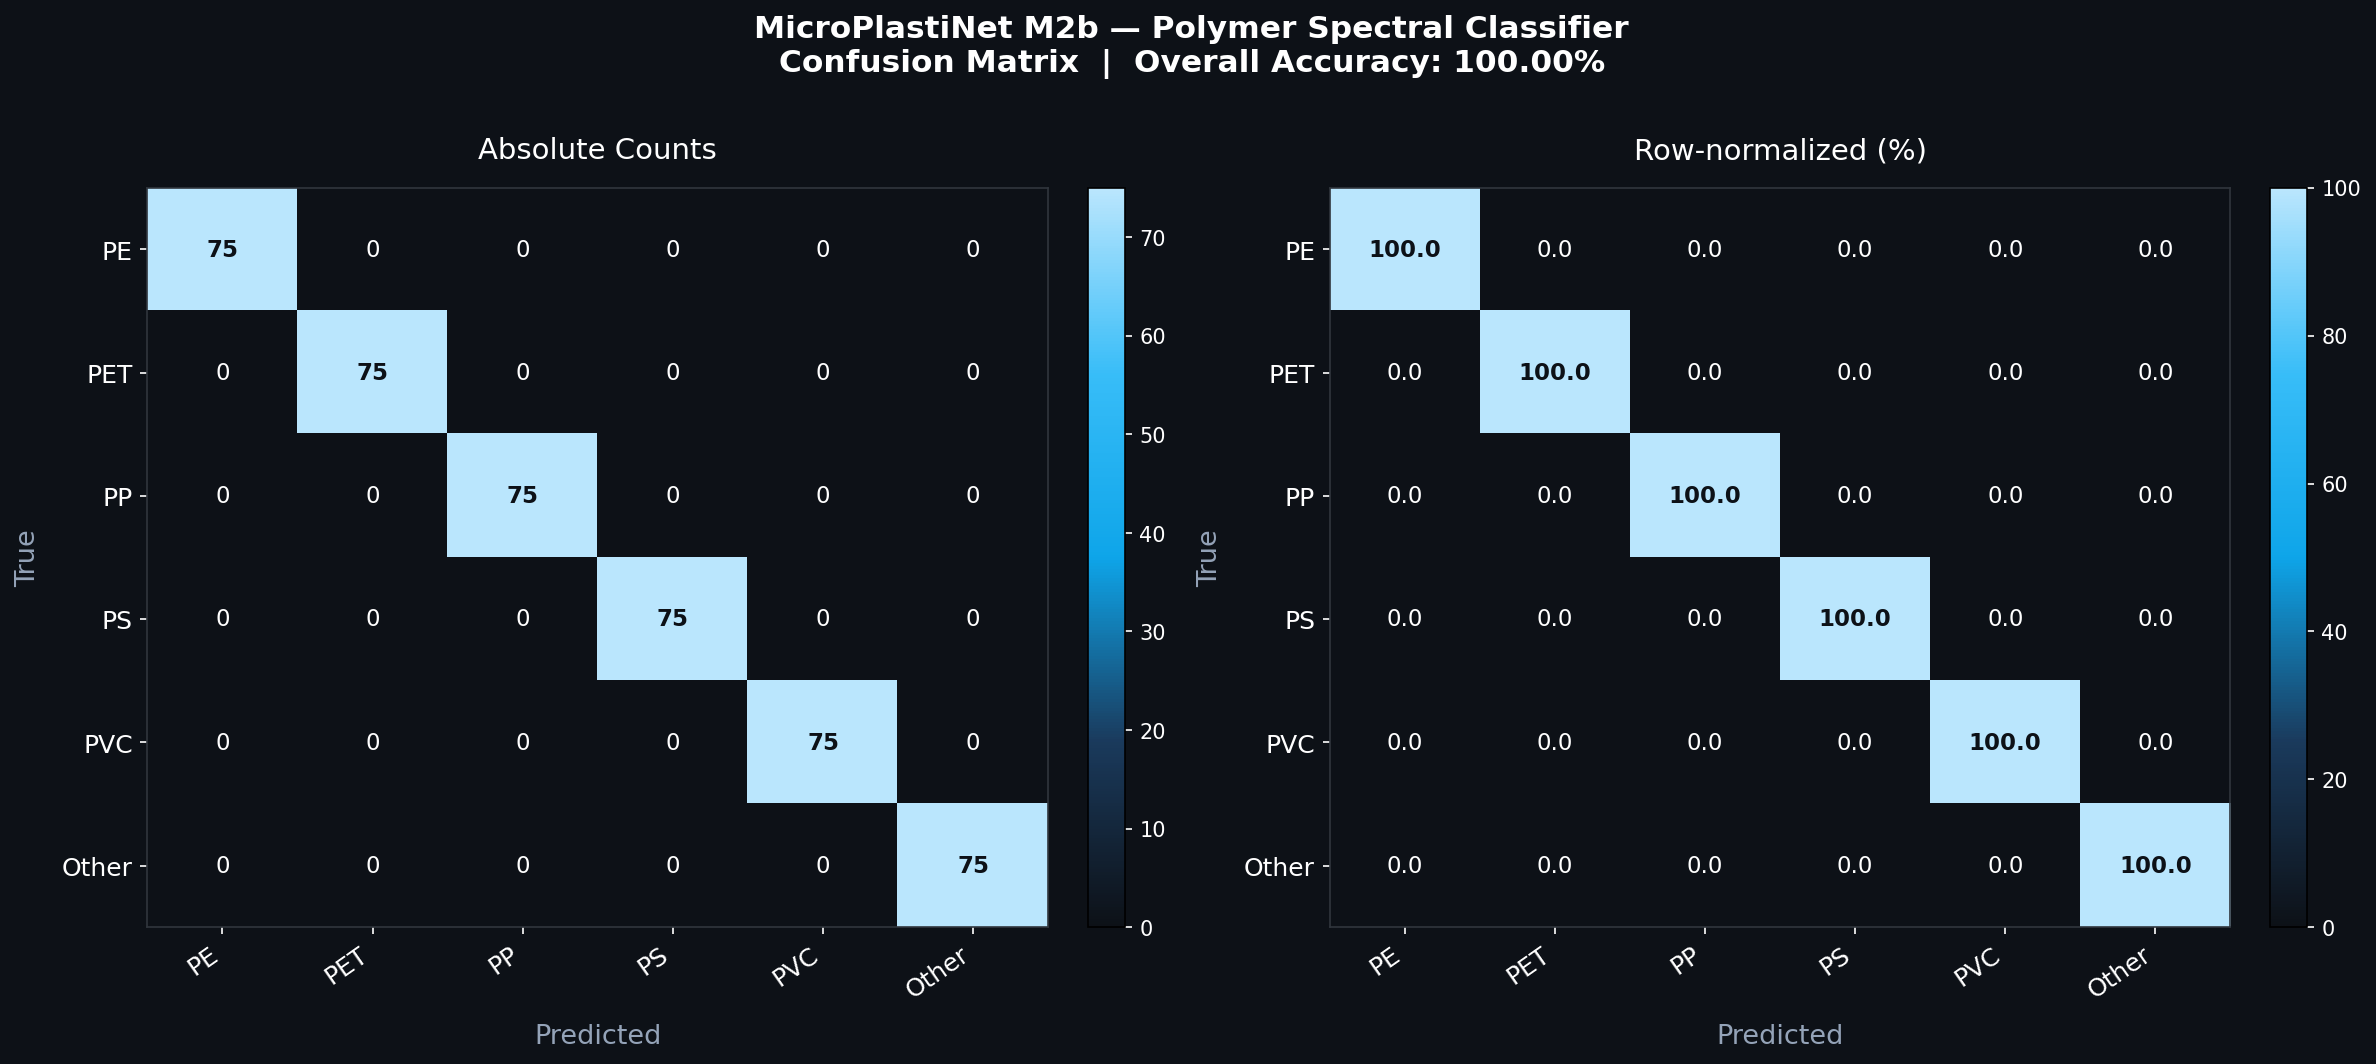
Spectral 1D-CNN — polymer identification
4-block 1D-CNN classifies polymer type from 901-point FTIR/Raman spectra. Synthetic spectra generated from published characteristic peaks of PE, PET, PP, PS, and PVC.
Graph neural network — source attribution
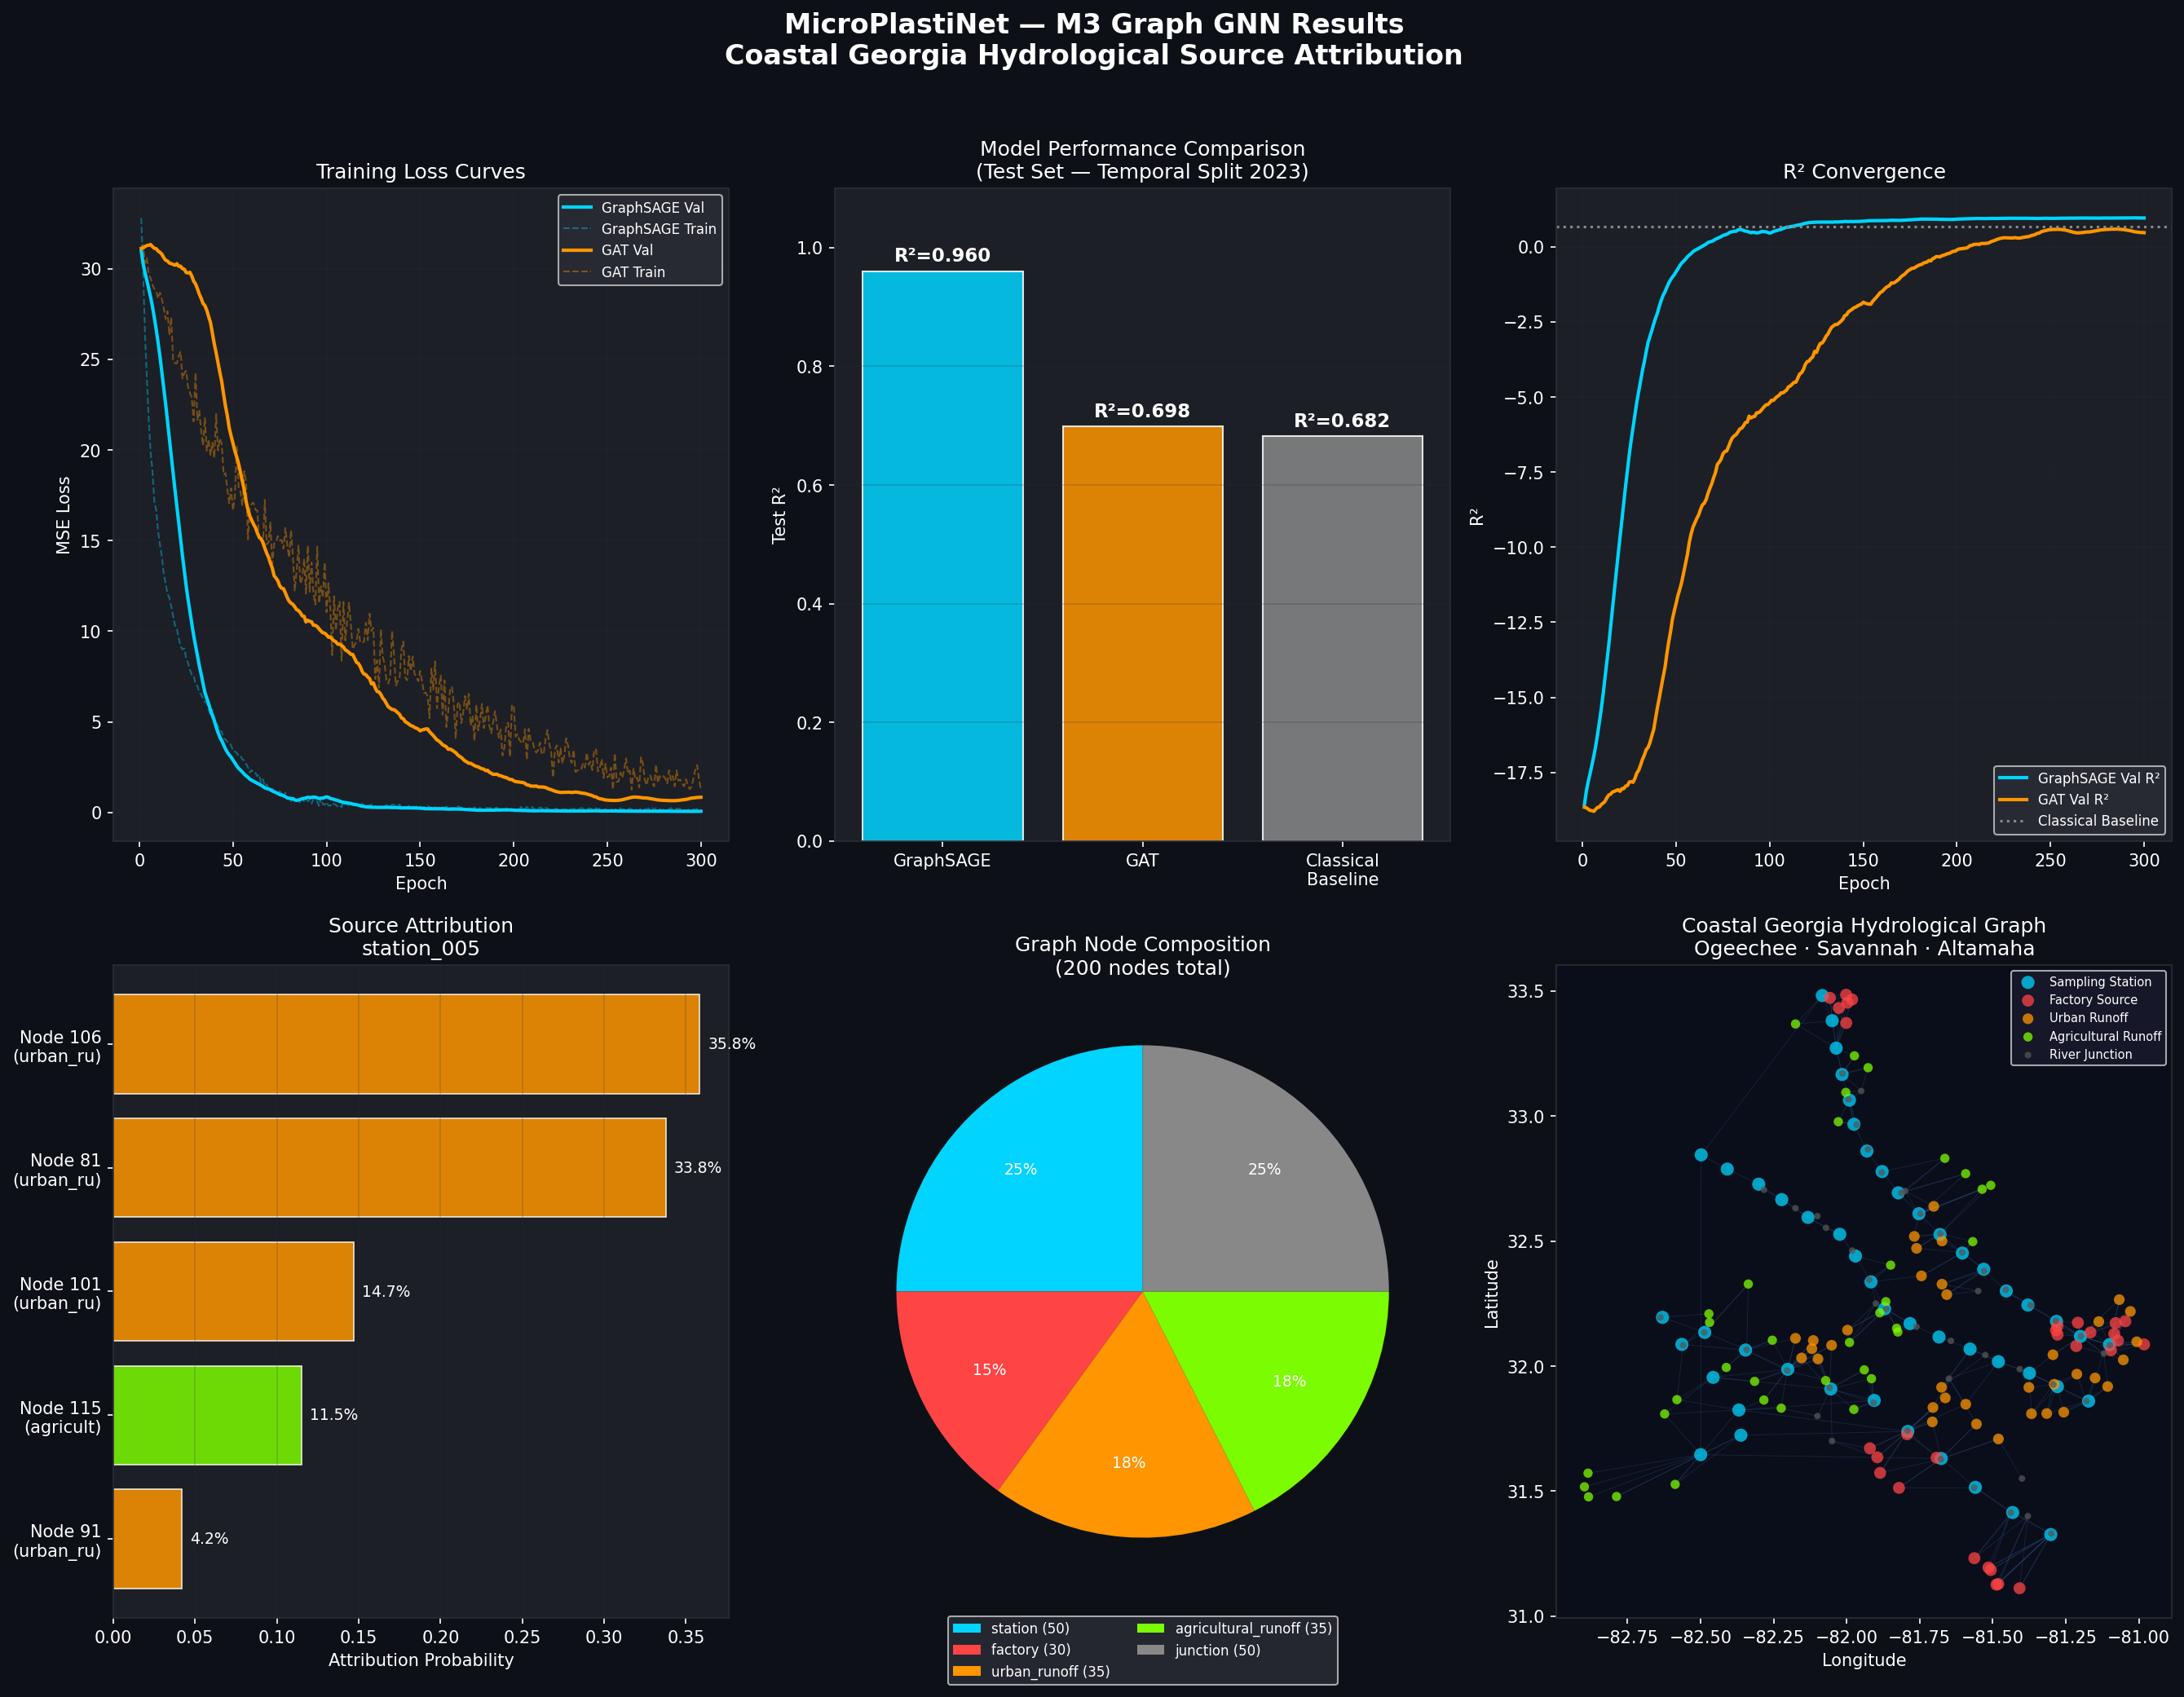
A 200-node directed flow graph spanning the Ogeechee, Savannah, and Altamaha watersheds. GraphSAGE predicts station-level concentration, GAT provides attention-based interpretability, and a classical centrality + Ridge baseline gives an honest comparison. The graph topology is synthetic (HydroSHEDS not available); edges and flow weights are procedurally generated to be physically plausible.
Concentration prediction — synthetic-on-synthetic
| Model | Test R² | MSE | MAE |
|---|---|---|---|
| GraphSAGE | 0.960 | 0.064 | 0.193 |
| GAT | 0.698 | 0.488 | 0.533 |
| Classical (centrality + Ridge) | 0.682 | 0.514 | 0.580 |
Source attribution — honest failure
| Metric | Value | Reading |
|---|---|---|
| Top-1 accuracy (predicted source matches true source) | 0.000 | FAIL |
| Mean Spearman ρ (ranked attribution vs ground truth) | −0.269 | FAIL |
Source: assets/m3_eval_report.json. The Integrated-Gradients head does not currently recover upstream sources — the attribution component is a known open problem and a primary motivation for pursuing this work in a PhD context with real data.
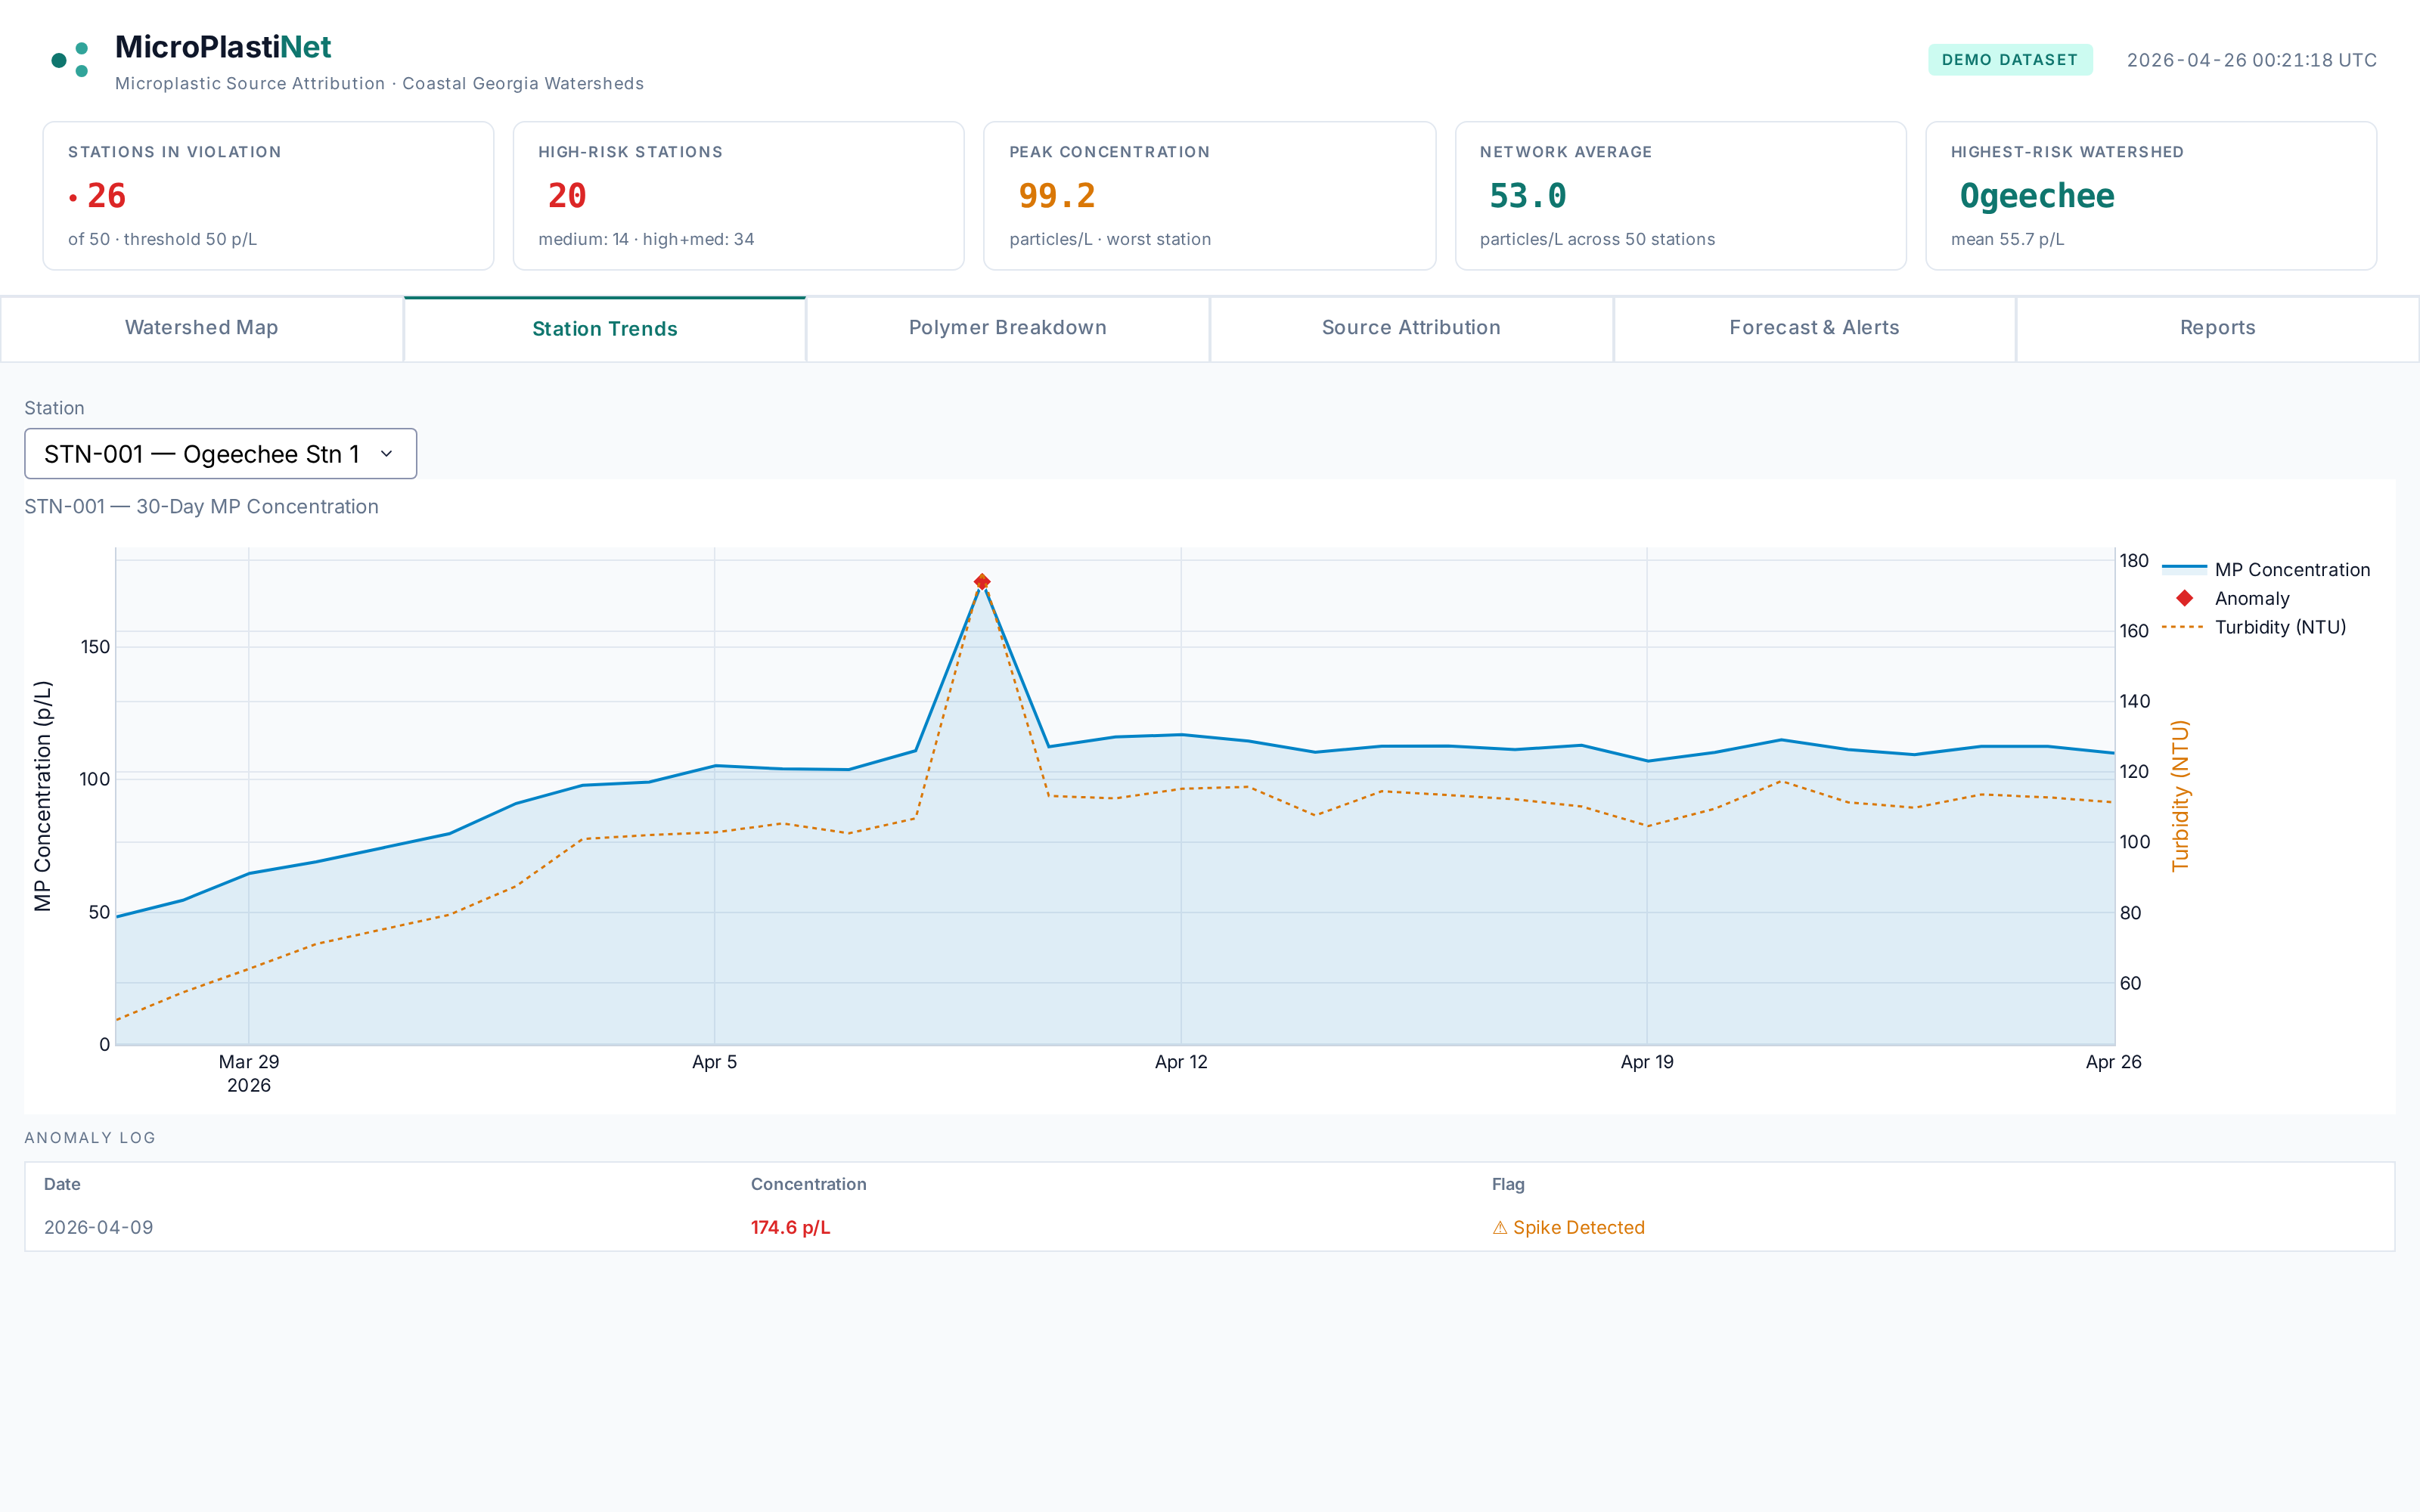
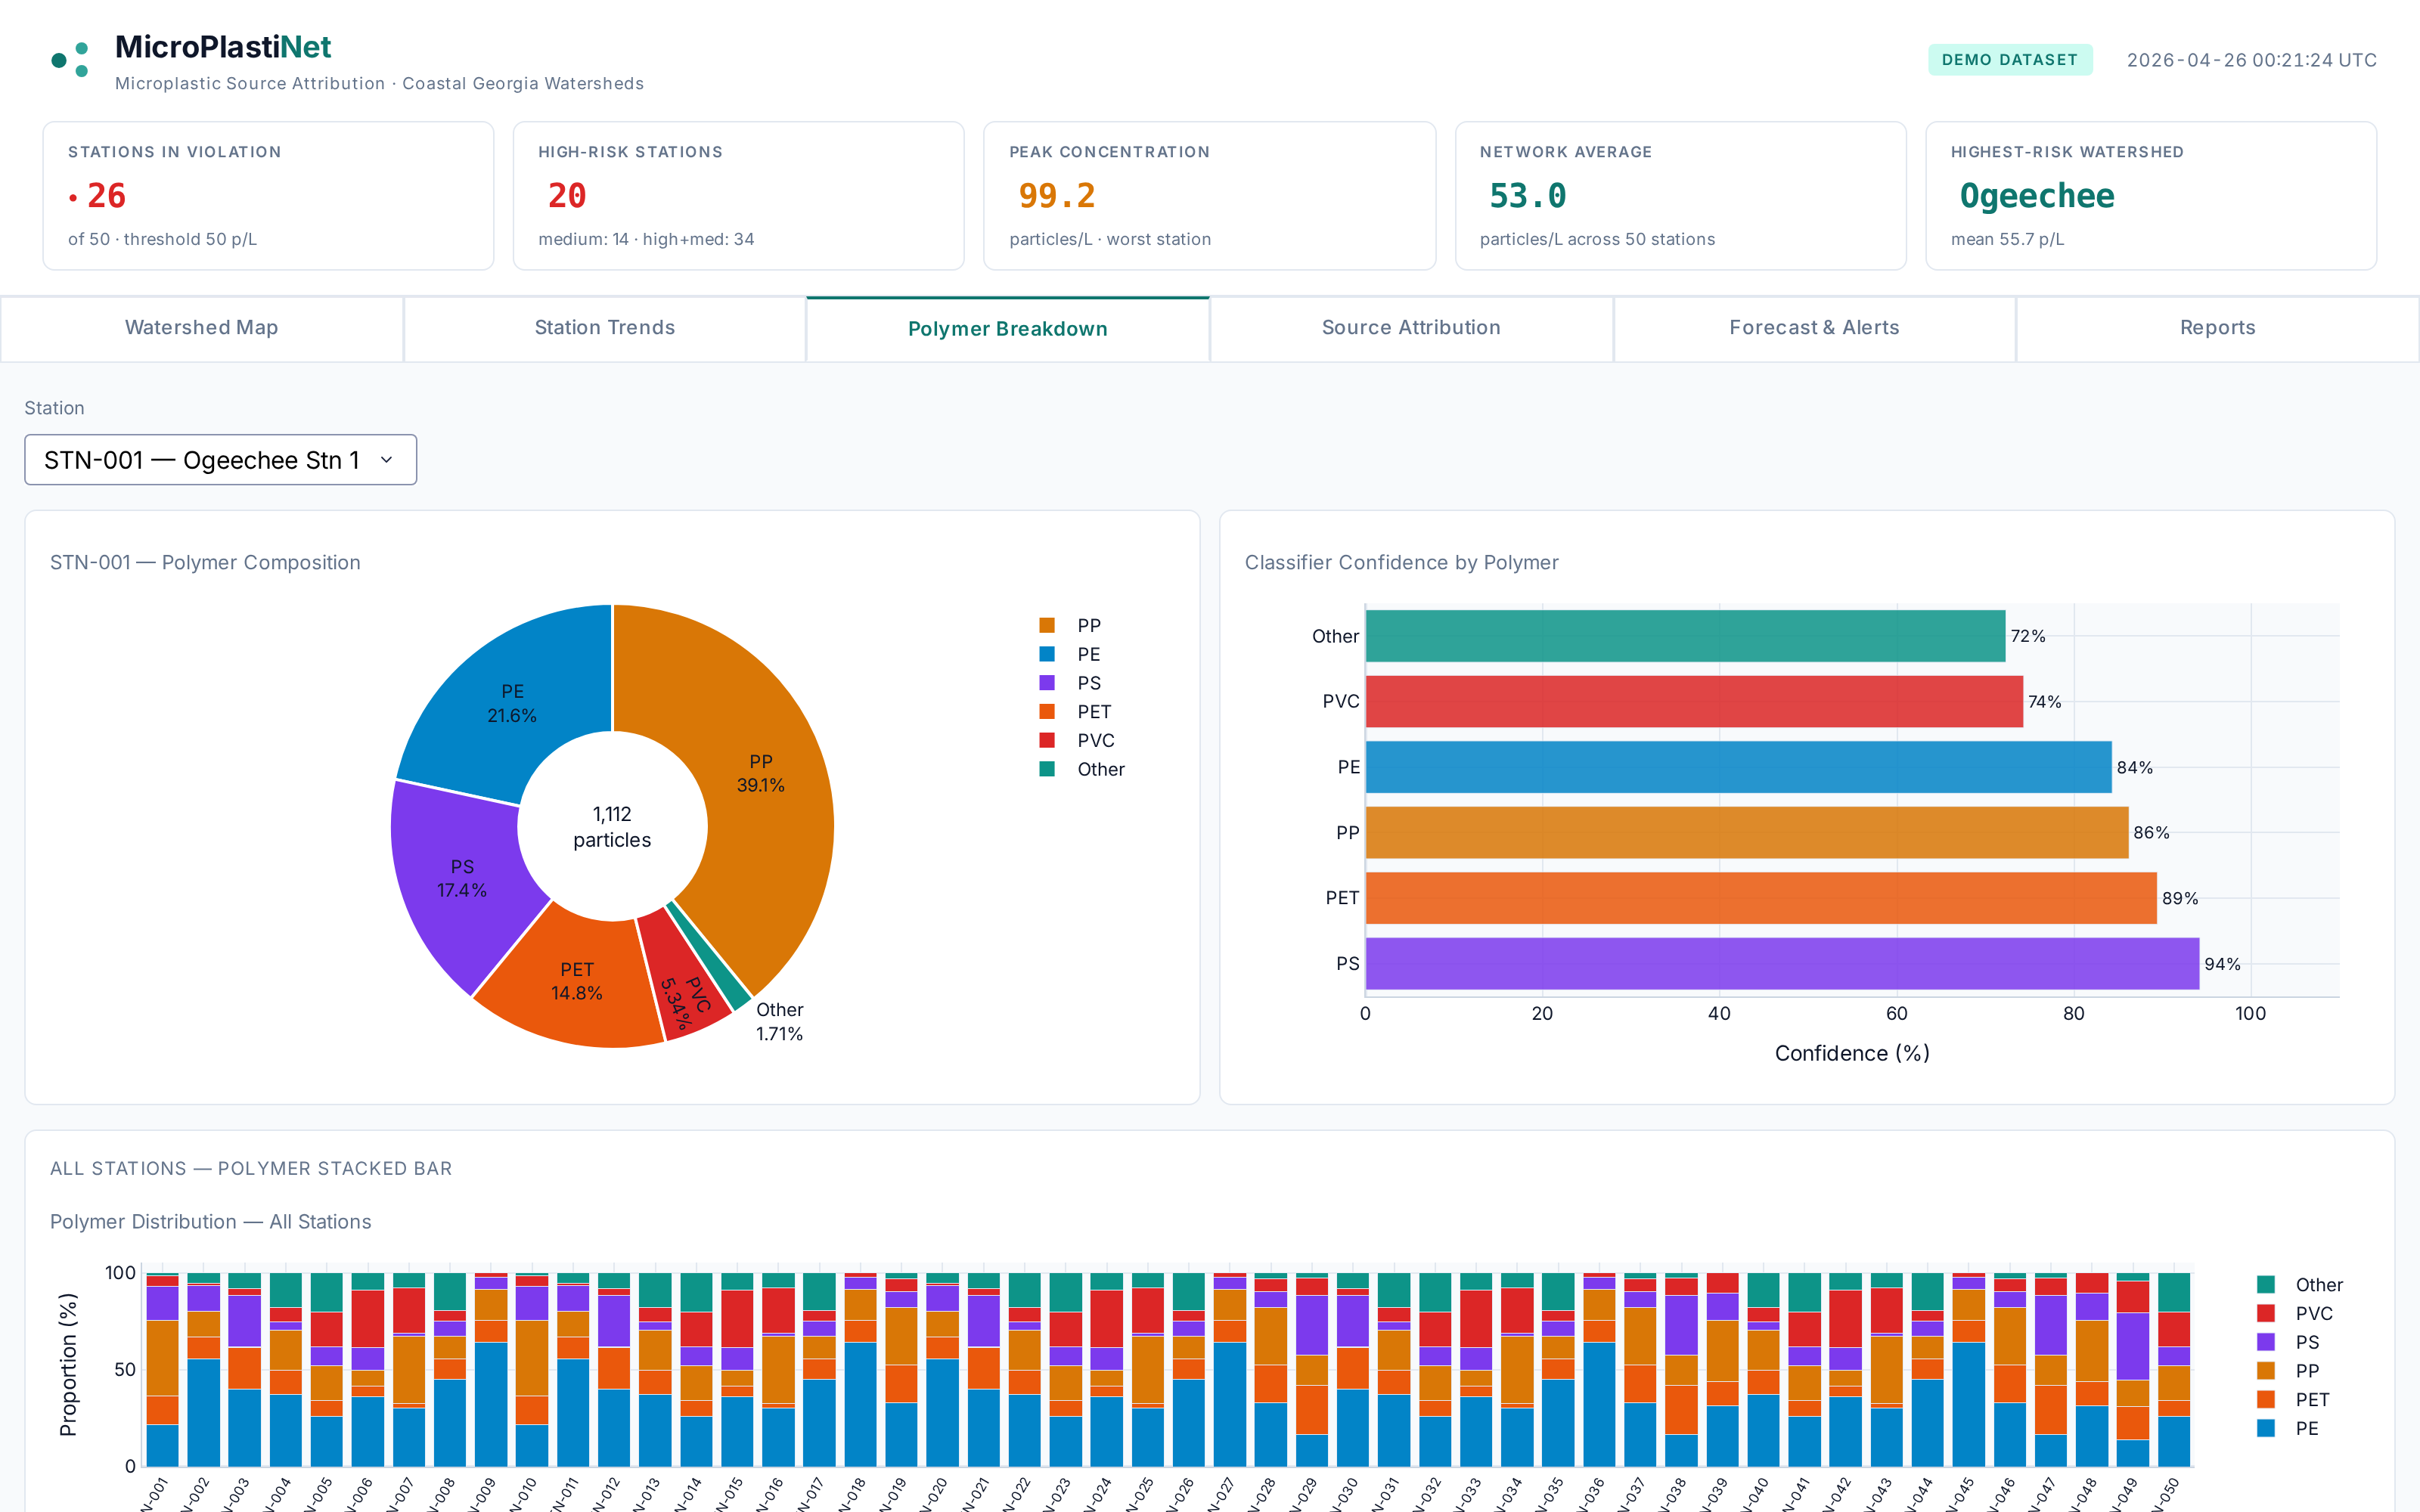
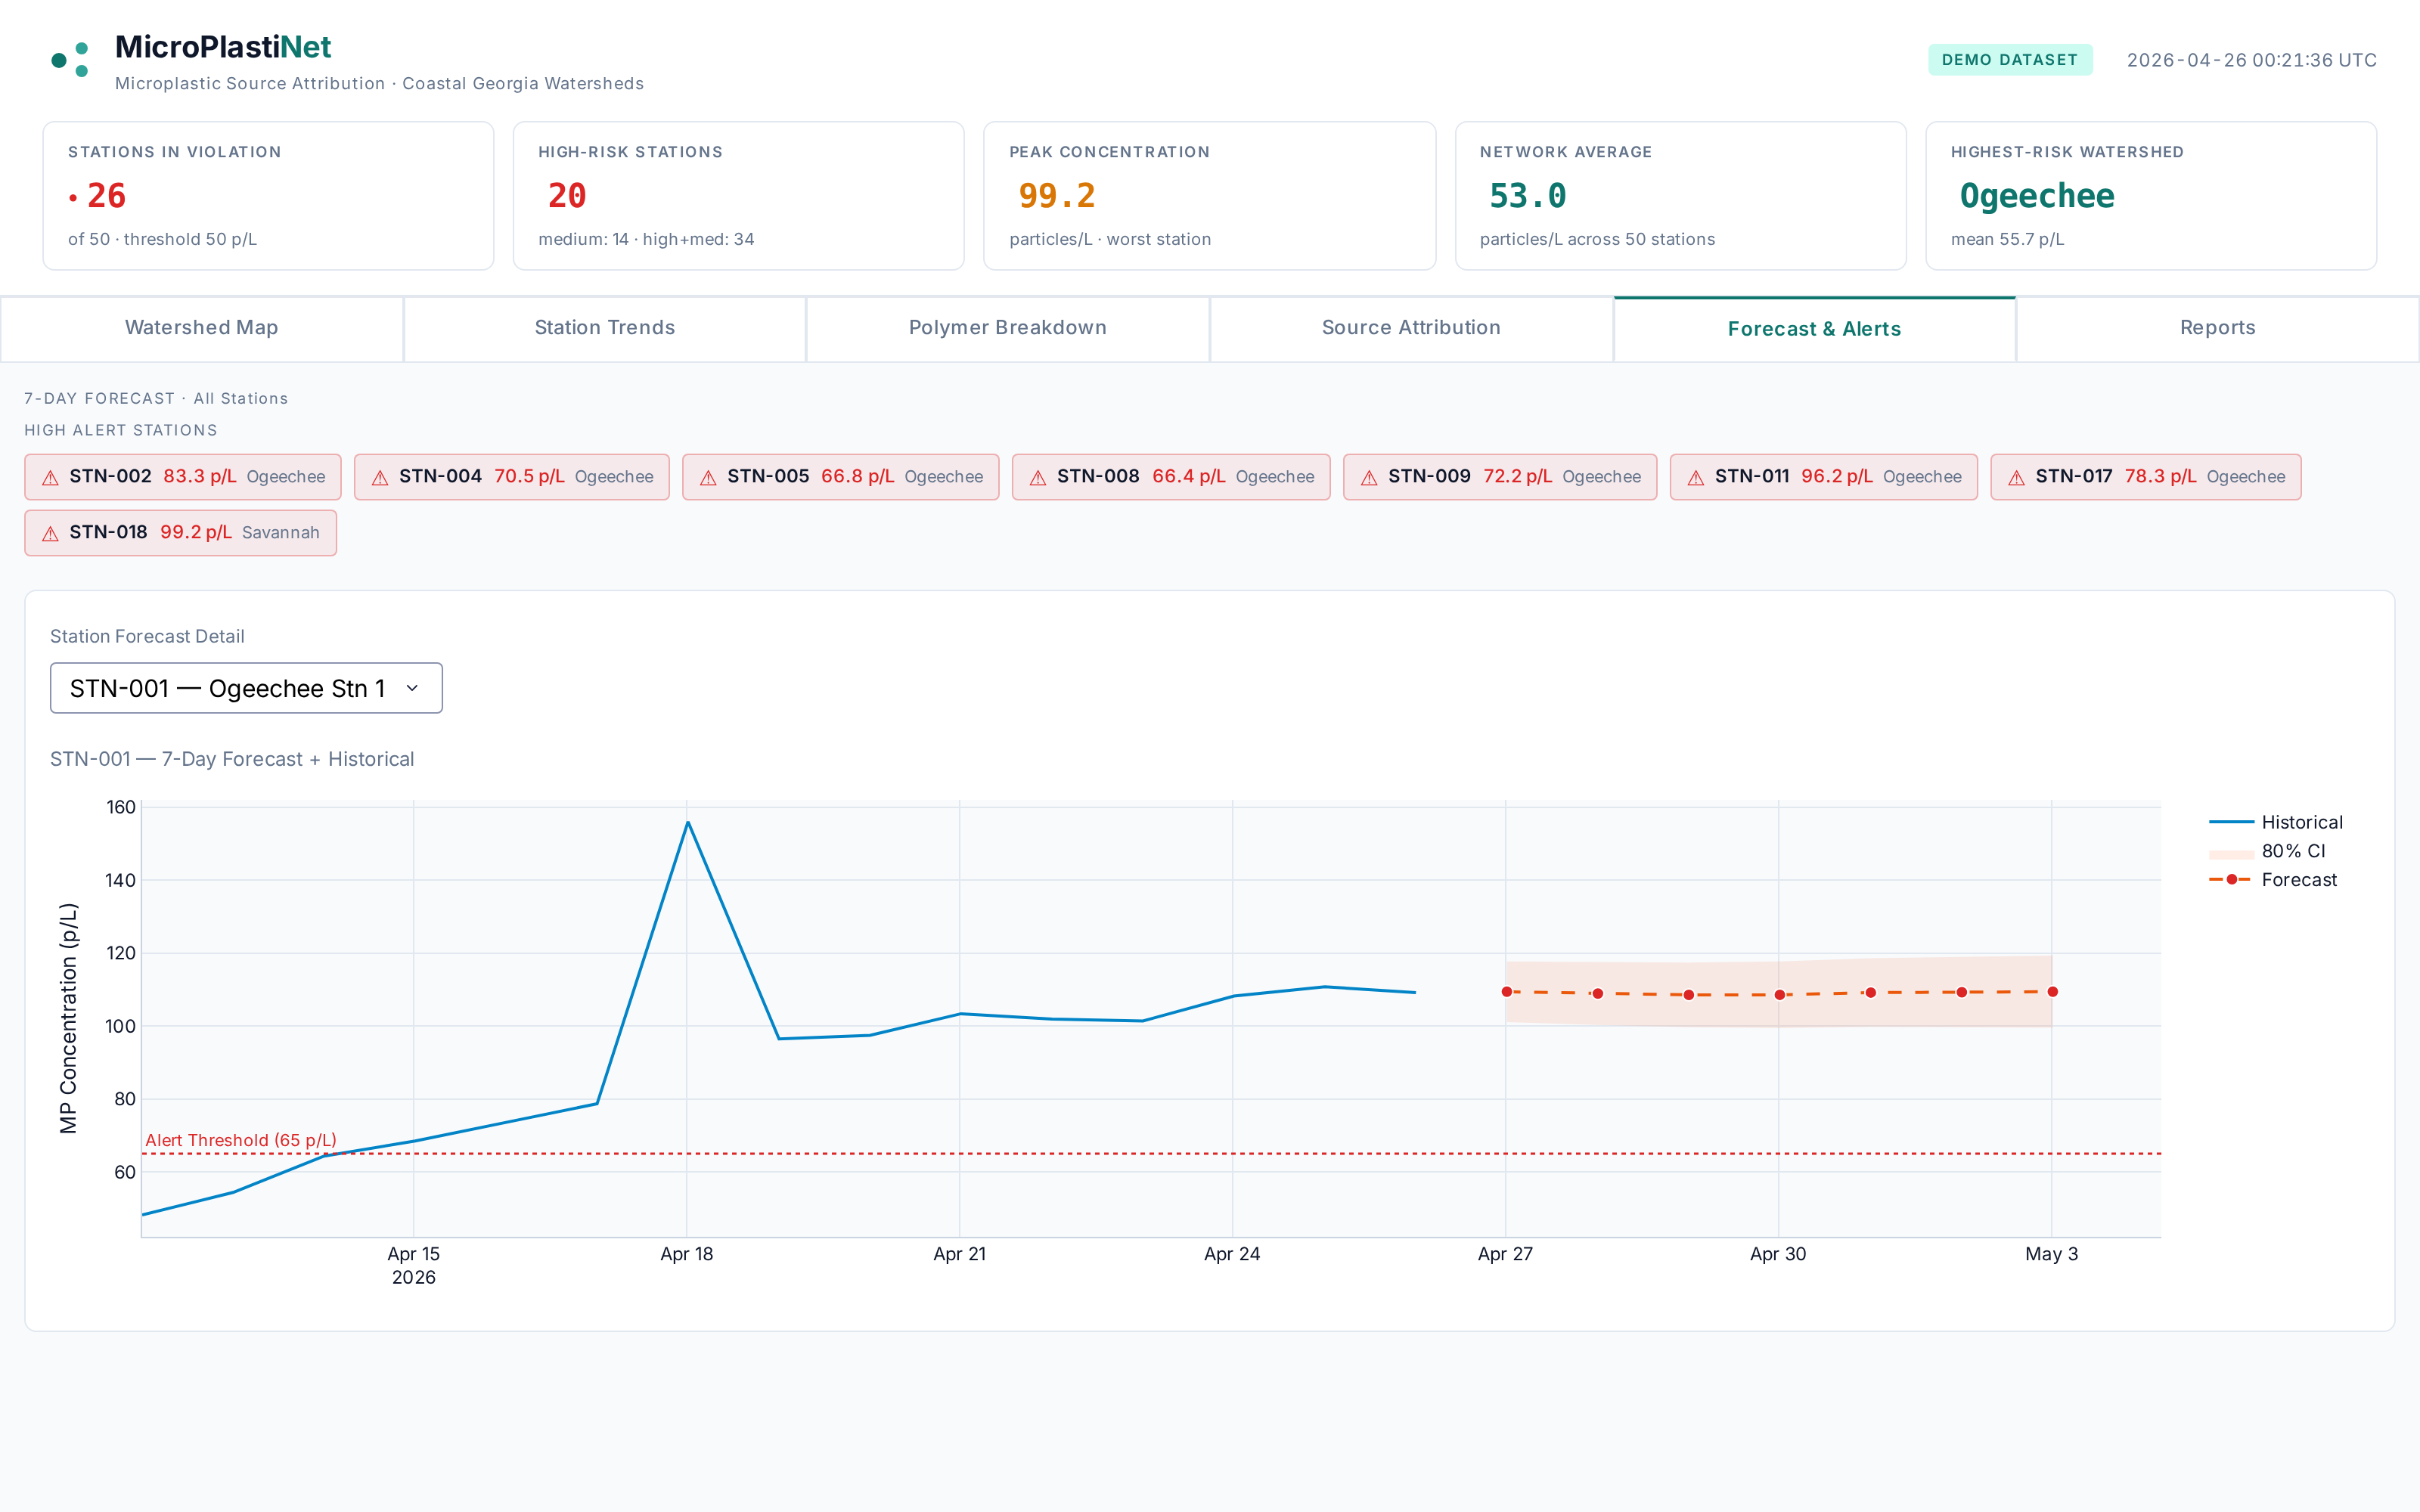
Compliance dashboard — six tabs
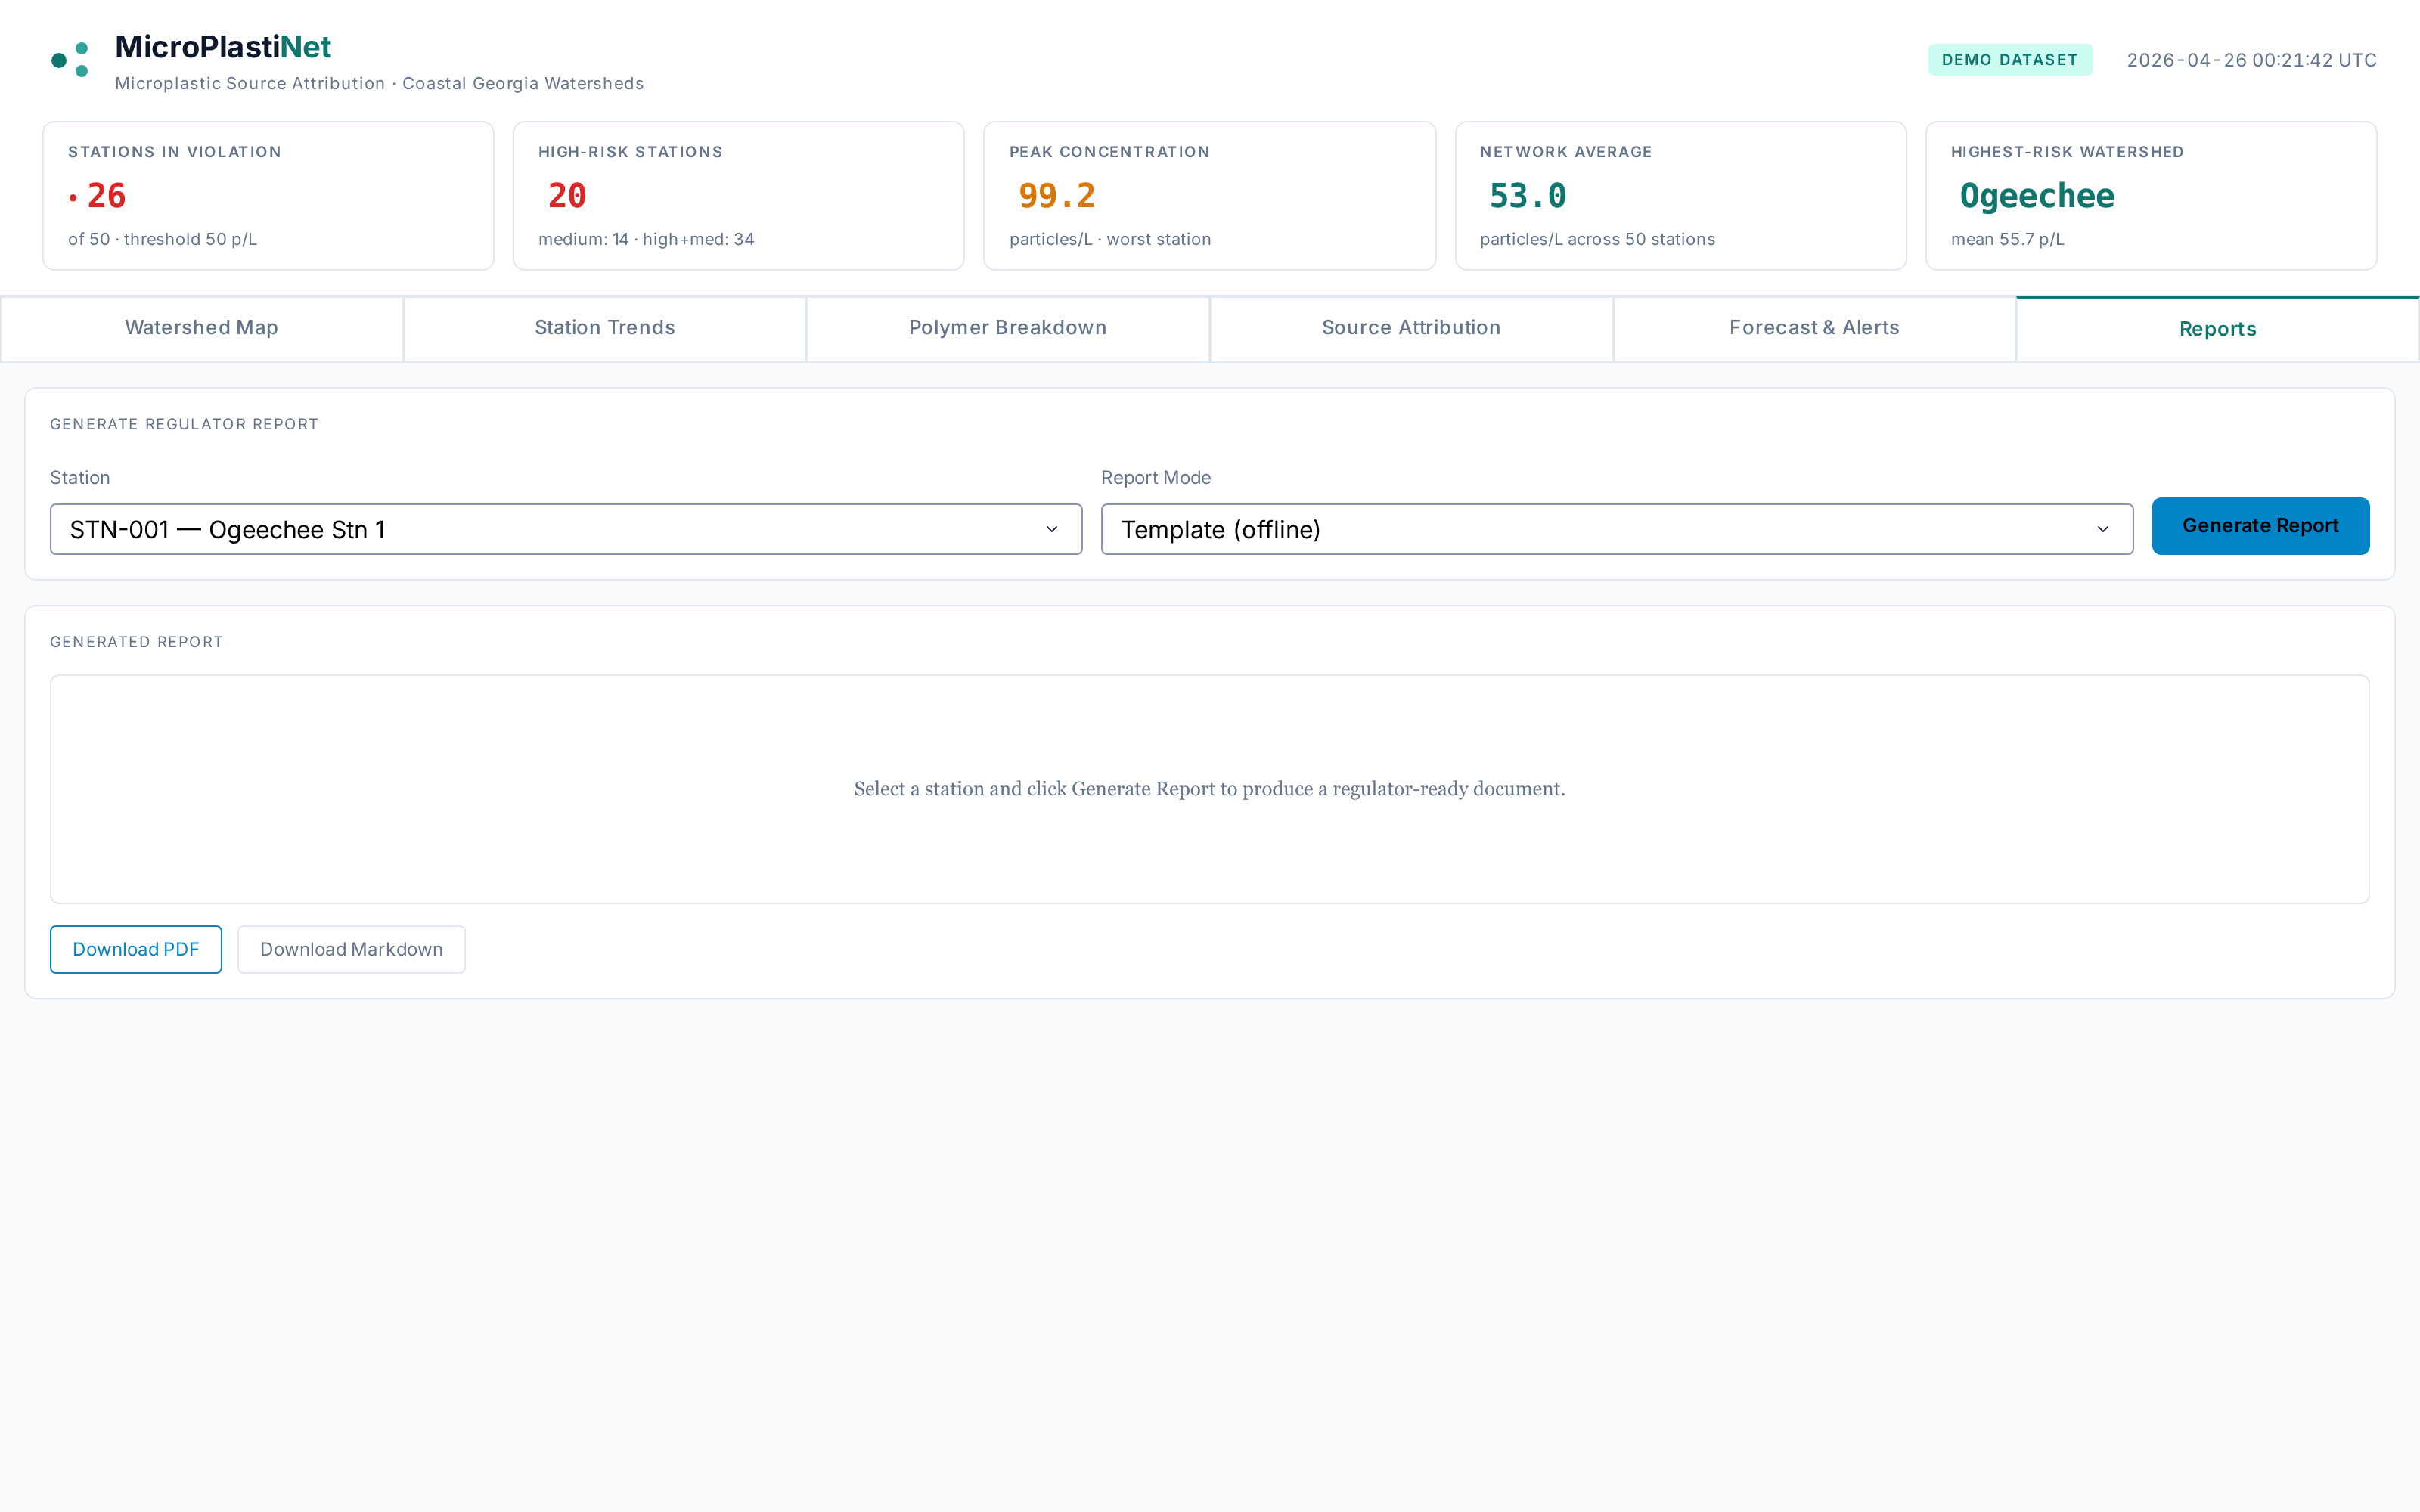
Click any thumbnail to enlargeA Plotly Dash application designed for environmental compliance officers. Watershed-level KPIs, station ranking by risk, polymer composition, GNN source attribution, forecasted threshold breaches, and one-click report generation.
GenAI regulator reports
Pydantic-validated report generator with both an offline template mode and an OpenAI mode. Outputs polished PDF (ReportLab) and Markdown — citing CWA § 1251, EPA 40 CFR Part 131, and the underlying evidence chain.
Cybersecurity — IoT integrity layer
Pollution-monitoring IoT is a tampering-magnet. M6 closes a gap that almost no published microplastic IoT paper addresses: HMAC-SHA256 over canonical JSON, per-payload nonces with bounded LRU cache, 5-minute timestamp freshness window, per-station key rotation with a 30-minute grace, and TLS 1.3 transport.
| Adversarial test | Result |
|---|---|
| Happy path | PASS |
| Payload tampering caught | PASS |
| Replay caught | PASS |
| Wrong-key signing caught | PASS |
| Stale timestamp caught | PASS |
| Key rotation grace window | PASS |